Figure 1.
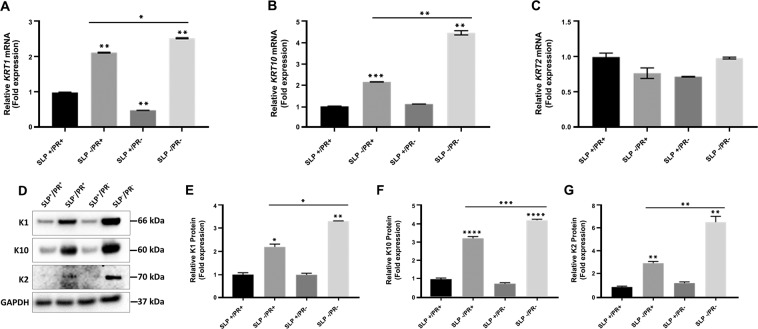
Effect of serum lipids (SLP) and phenol red (PR) on the expression of KRT1, KRT10 and KRT2 in NHEK cells. NHEK (200,000 cells) were mixed with 106 irradiated 3T3 fibroblasts in 2 ml growth medium per well of a 12 well plate for 3 days in four different RM+ media conditions, PR containing RM+ with or without SLP containing FCS (SLP+/PR+, SLP−/PR+), no PR in RM+ with or without SLP containing FCS (SLP+/PR−, SLP−/PR−) in triplicates for each growth condition. Feeder cells were removed by squirting PBS/EDTA and keratinocyte lysates were collected and analysed using qPCR and WB. mRNA expression data are shown for different genes (A) KRT1, (B) KRT10 and (C) KRT2 as fold expression normalised to the expression of two housekeeping genes, POLR2A and YAP1 under different growth conditions. (D) NHEK (500,000 cells) were mixed with 1 million irradiated 3T3 fibroblasts in 4 ml growth medium per well of a 6 well plate for 3 days in the above four different RM+ media conditions in triplicates for each growth condition. Feeders were removed as above and SDS cell lysate containing 20 µg total protein (measured by Lowry’s method using BSA as standard) was analysed by western blotting for expression of K1, K2 and K10 under different growth conditions. GAPDH was used as a loading control. Relevant bands were cropped from different blots and grouped together. Original blots are shown in Supplementary Fig. S1. Quantification of protein bands was carried out by Image J and shown for (E) K1, (F) K10 and (G) K2. Statistical analyses: n = 3, Error bars = SEM, Student’s t-test was performed to calculate p values using Microsoft Excel. One-way ANOVA (shown by a horizontal line over the graph) was used to determine the statistical significance in gene expression between different growth conditions. The p values are given by asterisks (*p < 0.05, **p < 0.01, ***p < 0.001 and ****p < 0.0001).

