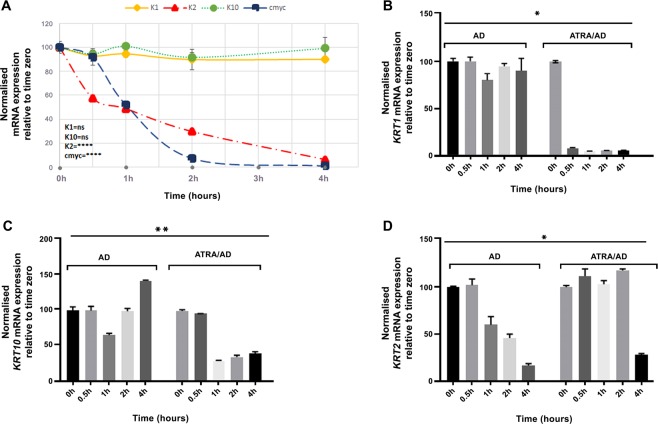
Figure 7.
Differential stability of KRT1, KRT10, KRT2 and c-MYC mRNA in NHEK. (A) NHEK (200,000 cells) mixed with 106 irradiated 3T3 fibroblasts were co-cultured in 2 ml RM+ medium containing PR per well of a 12 well plate in triplicates for each gene. Cells were treated with 2 µg/ml AD for up to 4 h, the feeder was removed by squirting PBS/EDTA and the NHEK were lysed for qPCR analysis of KRT1 (yellow diamond), KRT10 (green circle), KRT2 (red triangle) and c-MYC (blue square) gene expression analyses. All data are shown as relative expression normalised to POLR2A and YAP1, untreated cells were used as zero-time control. NHEK (200,000 cells) mixed with 106 irradiated 3T3 feeder cells were grown in CS-FCS containing RM+ medium without PR per well in a 12 well plate in triplicates for different time point for each gene. ATRA was added at 1 µM for 24 h prior to adding AD for up to 4 h after which the 3T3 feeder was removed by squirting PBS/EDTA and qPCR lysates were collected for (B) KRT1, (C) KRT10 and (D) KRT2 gene expression analyses. DMSO/EtOH was used as vehicle control (0.001%/0.01% mixture) for ATRA treated samples. All data are shown as relative expression normalised to DMSO/EtOH control and two reference genes, POLR2A and YAP1. Statistical analyses: n = 3, Error bars =SEM. Two-way ANOVA (Time, Treatment) was used to calculate p values in (B–D), one-way ANOVA in (A), p values are given by asterisks (ns = p > 0.05, *p < 0.05, **p < 0.01 and ****p < 0.0001).

