Figure 1.
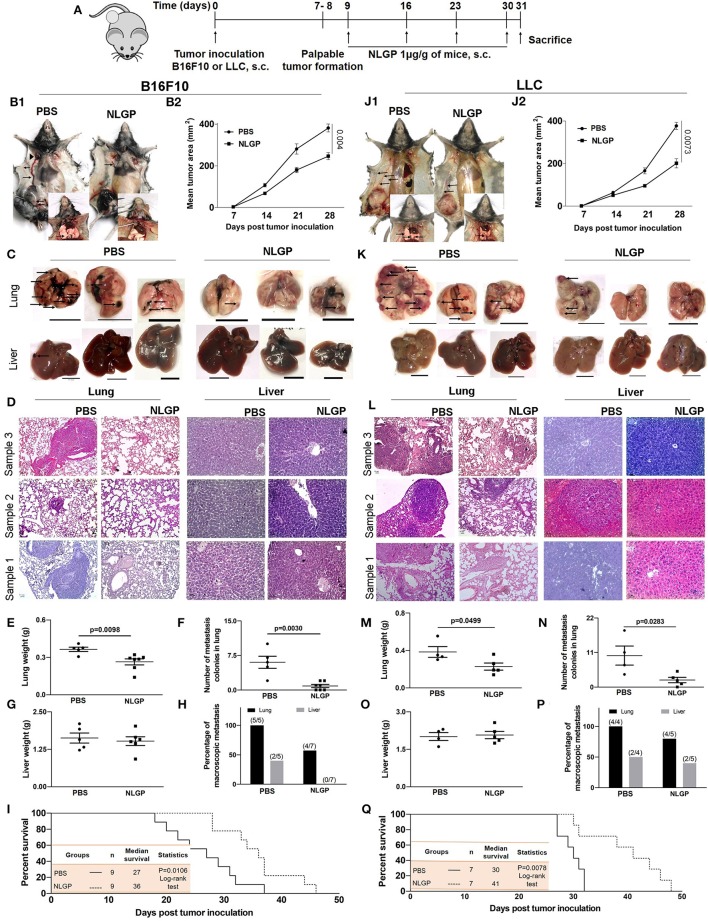
Neem leaf glycoprotein attenuates both the primary tumor and spontaneous metastasis of B16F10 and LLC. (A) Experimental design showing tumor inoculation and NLGP treatment. The tumor was inoculated subcutaneously (s.c.) (n = 3, repeat for three times for B16F10 and n = 3, repeat for two times for LLC), and after the formation of palpable tumor, mice were treated with NLGP once a week for 4 weeks. (B1,J1) Representative photographs of primary tumor on day 31 after s.c. inoculation of B16F10 and LLC in PBS- and NLGP-treated mice, respectively. Inset: Pulmonary metastasis of corresponding mice. Metastatic nodules are shown by arrows. Arrows indicate profound angiogenesis at ventral skin in the PBS group. Arrowhead indicates the node metastasis. (B2,J2) The tumor growth curves of B16F10 and LLC tumors in C57BL/6 mice. Each data point indicates mean tumor volume ± SEM. Representative photographs of lungs and livers harvested on day 31 post- (C) B16F10 and (K) LLC s.c. inoculation. Arrows point to surface metastatic nodules, which indicate 10 mm. Scale bar was assigned with the aid of ImageJ software after adjusting the scale with the original ruler. Both organs and ruler were photographed in the same frame. Representative hematoxylin-eosin staining of 5 μm lung (10×) and liver (20×) sections of B16F10 (D) and LLC (L) from PBS- and NLGP-treated mice. Arrow indicates metastatic foci. Scale bar 50 μ. Dot plots indicate (E,M) mean weight ± SEM of the lung; (F,N) numbers of metastatic nodules ± SEM; (G,O) mean weight ± SEM of the liver of mice harvested 31 days after s.c. B16F10 and LLC cell inoculation, respectively, in each case. Unpaired t-test was used to determine statistical significance. P-values are indicated in the corresponding graph. (H,P) Bar diagrams indicate the percentage of macroscopic metastasis in lung and liver from B16F10 and LLC inoculated. (I,Q) Kaplan-Meier survival analysis for B16F10 and LLC, respectively (n = 9 and n = 7 for B16F10 and LLC, respectively, repeat once). Data were analyzed by log-range test. Inset: Indicates mice number, median survival, and statistical value.

