Figure 4.
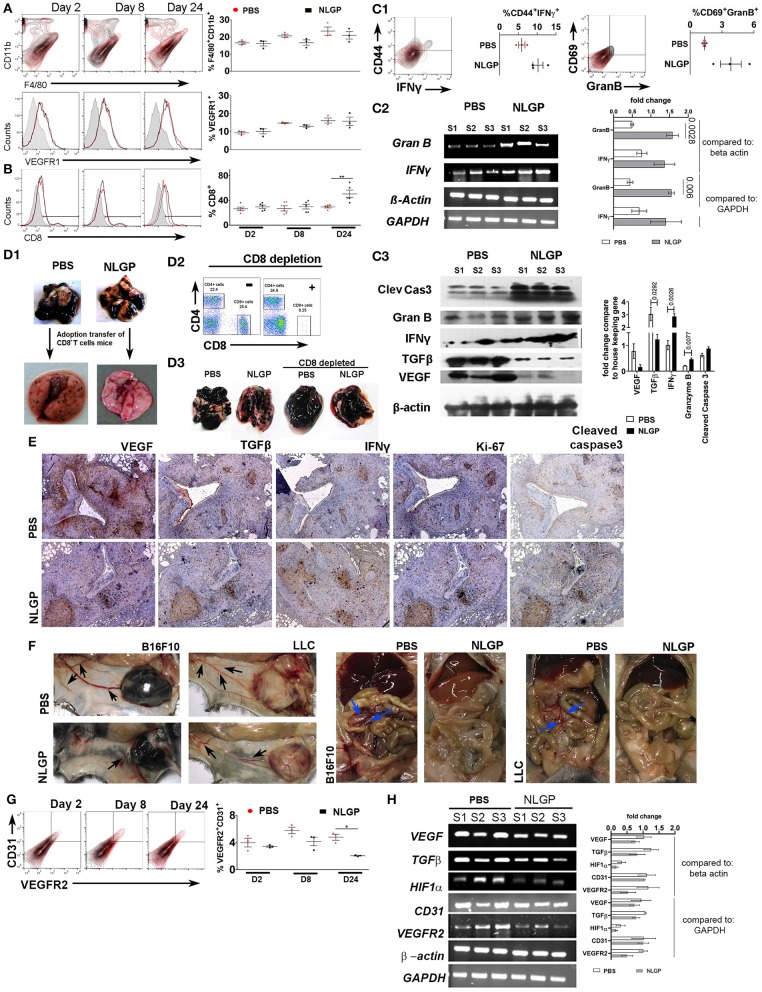
Neem leaf glycoprotein intervenes metastatic colonization. Representative overlaid counter plot and histograms show the status of (A) F4/80+CD11b+ and VEGFR1+ and (B) CD8+ T cells. Corresponding dot plot indicates mean percentage of target cells ± SEM (n = 3, repeat for one, for F4/80+CD11b+ and VEGFR1+, and n = 5 for CD8+ T cells repeat for one). (C1) Representative figure indicates presence of CD44+IFN-γ+ and CD69+GranB+ cells within gated CD8+ T cells on day 24 in PBS- and NLGP-treated lungs. Corresponding dot plot indicates percentage of target cells ± SEM (n = 3, repeat for one). (C2) Different gene transcription was analyzed by RT-PCR. Agarose gel shows the expression of IFNγ and GranB transcripts. Corresponding bar diagram indicates the fold change in expression as measured by ImageJ software. (C3) Total protein was isolated from PBS- and NLGP-treated lungs (day 24; n = 3, repeat for one) to check the expression of cleaved caspase 3, granzyme B, IFN-γ, TGF-β, and VEGF at protein level by Western blot. Expression intensity was measured by LI-CORE lite software. Unpaired t-test was performed to analyze statistical significance. The p-values are indicated in figure. (D1) CD8+ T cells were isolated by magnetic bead positive selection from PBS- and NLGP-treated mouse lung (day 24) and adoptively transferred into another group of mice with metastases (see also Figure S4DA). The second group of mice was sacrificed, and lungs were harvested. Representative lung image indicates fewer number of metastatic nodules in mice, received adoptively transferred CD8+ T cells from NLGP-treated mice (n = 3, repeat for one; see also Figures S4DA.1,A.2). (D2) Flow-cytometric dot plot shows the status of CD8+ T cells in peripheral blood after in vivo CD8+ T cell depletion (for details, see Figure S4DB.1). (D3) Representative photograph of lungs from different groups shows that CD8+ T cell depletion majorly abrogate NLGP's antimetastatic efficiency (n = 3, repeat for one and Figure S4FB.2). (E) Immunohistochemistry was performed in paraffin-embedded sequential lung sections (5 μm) for VEGF, TGF-β, IFN-γ, Ki-67, and cleaved caspase 3 from PBS- and NLGP-treated mice. (F) Representative image shows tumor (B16F10 and LLC)–induced angiogenesis in PBS- and NLGP-treated mice for both SMM and EMM. Black arrows indicate angiogenesis at ventral skin. Blue arrows indicate angiogenesis at mesenteric site (see Figures 1B1,J1; Figures S4FA,B). (G) Representative flow-cytometric overlaid counter plot indicates presence of CD31+ and VEGFR2+ cells in PBS- and NLGP-treated mice lungs (day 24, n = 3, repeat for one). Corresponding dot plot indicates percentage of target cells ± SEM (n = 3). (H) Agarose gel electrophoresis data show the expression of VEGF, TGFβ, HIF1α, CD31, and VEGFR2 transcripts in three different samples against the housekeeping gene beta-actin and GAPDH. (N.B., C2,H used the same housekeeping gene as control; as both are analyzed from same lung samples) Corresponding bar diagram indicates the fold change in expression. Expression intensity was measured by ImageJ software. *p < 0.05, **p < 0.005.

