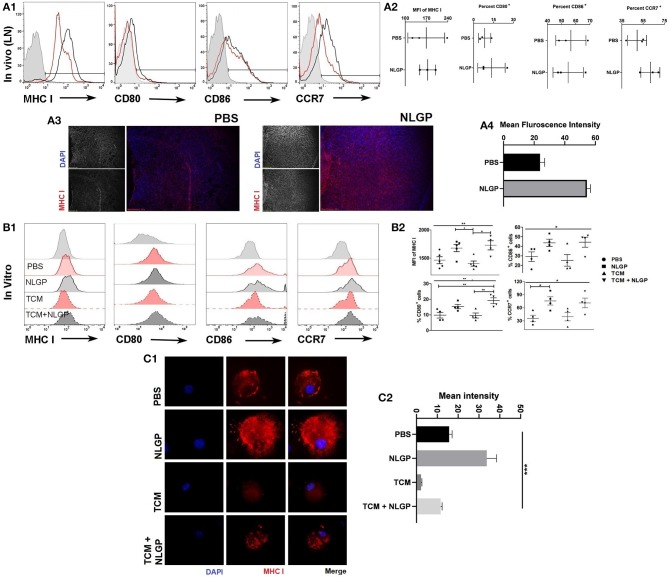
Figure 5.
Neem leaf glycoprotein–activated DCs modulate CD8+ T cells. (A1) Following 48 h of NLGP administration, TDLN was isolated, and MHC-I, CD80, CD86, and CCR7 expressions were measured by flow cytometry (n = 3, repeat for once). (A2) Bar diagram indicates the mean of MFI ± SEM of MHC-I or mean percentage positive ± SEM of CD80, CD86, and CCR7 (n = 3, repeat for once). (A3) Representative image shows the MHC-I expression in PBS- and NLGP-treated TDLN (n = 3, repeat for one). (A4) Bar diagram indicates mean fluorescence intensity of MHC-I expression ± SEM of lymph node. (B1) Immature BmDCs (day 6) were treated with and without TCM and NLGP for 32 h followed by analysis of MHC-I, CD80, CD86, and CCR7 expression. Representative offset histograms show expression of MHC-I, CD80, CD86, and CCR7 (n = 1, repeat for five times for MHC-I and four times for CD80, CD86, and CCR7). (B2) Dot plot shows the mean target cells ± SEM. One-way ANOVA was used followed by Tukey multiple comparisons. (C1) Representative image shows the surface MHC-I expression on BmDCs. (C2) Bar diagram represents mean MHC-I expression intensity ± SEM (n = 1, repeat for three times). *p < 0.05, **p < 0.005.

