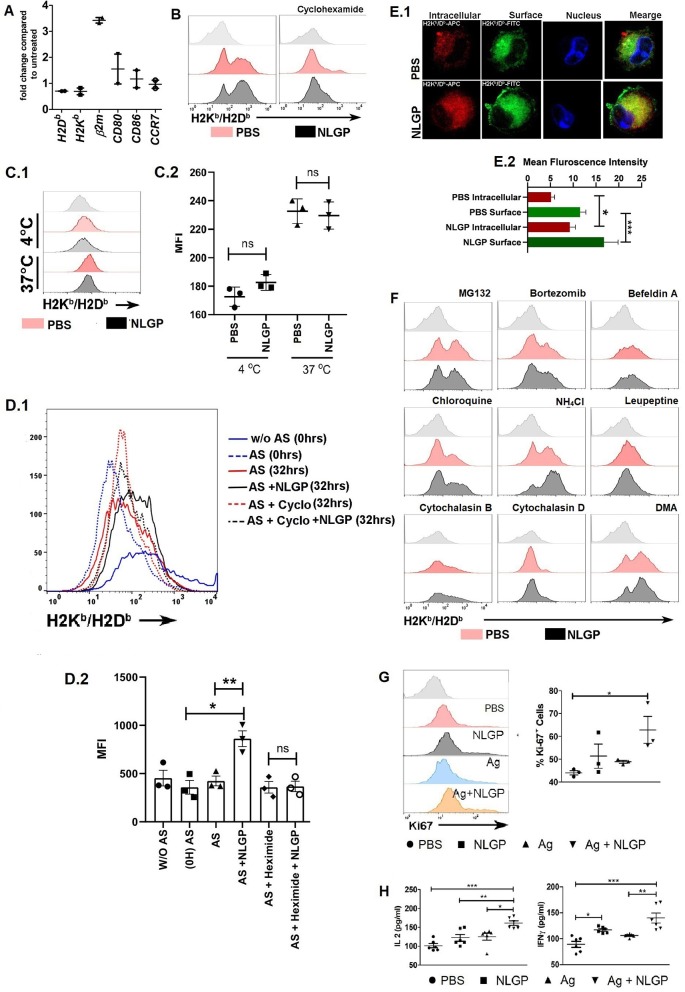
Figure 6.
Neem leaf glycoprotein–mediated MHC-I upregulation is translation dependent. (A) Expressions of H2K, H2D, β2m, CD80, CD86, and CCR7 were assessed by real-time PCR. Data were analyzed by delta-delta-Cq methods compared to β-actin (n = 1, repeat for once) (n = 2). (B) Effect of cycloheximide (5 μM) H on NLGP-induced MHC-I upregulation was assayed. Offset histogram plot represents one of the experimental data of three independent experiments (n = 1, repeat for three times; see also Figure S6DA). (C1) Effect of NLGP on normal MHC-I endocytosis was determined. Representative histogram figure shows NLGP does not alter MHC-I endocytosis. (C2) Dot plot indicates mean MFI ± SEM of MHC-I molecules from MHC-I endocytosis assay. Data indicate that at 37°C NLGP did not alter MHC-I endocytosis (n = 1, repeat for three times). Data were analyzed by one-way ANOVA. (D1) Representative data show one result from three independent experiments of acid striping. (D2) Dot plot indicates mean MFI ± SEM of MHC-I molecules from acid stripping experiment (n = 1, repeat for three times). Data were analyzed by one-way ANOVA. (E1) Representative image shows the expression of intracellular and surface MHC-I by confocal microscopy (n = 1, repeat for four times). (E2) Bar diagram represents the mean intensity ± SEM of intracellular and surface MHC-I. (F) Effect of different inhibitors on the NLGP-induced MHC-I upregulation (see also Figure S6DA) (G) Representative histogram represents expressions of Ki-67. Dot plot shows the mean ± SEM (n = 1, repeat for three times). (H) Dot plot indicates mean IL-2/IFN-γ ± SEM by ELISA (n = 2, repeat for three times). One-way ANOVA was used and followed by Tukey multiple comparisons. *p < 0.05, **p < 0.005, ***p < 0.0005.

