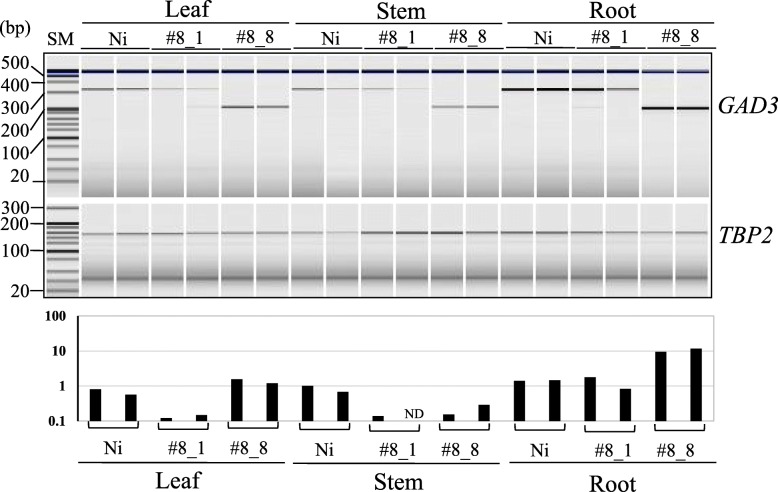
Fig. 4.
Semi-quantitative RT-PCR analysis of RNA transcribed from OsGAD3 genes in wild-type (Ni) and genome-edited rice (lines #8_1 and #8_8 in Table S1). Total RNA was isolated from the tissues indicated above the lanes. Single-stranded cDNA synthesized from each RNA (2 μg) with an oligo-dT primer using reverse transcriptase was amplified with an appropriate primer set (Table S2). PCR conditions were as follows: cycles of 95 °C 30 s, 60 °C 30 s, 72 °C 30 s were repeated by 27 times for GAD3 and 25 times for TBP2. OsGAD3 and TBP2 indicate reactions with primers GAD3-F57 and GAD3-R379 or TBP2-F and TBP2-R as an internal control, respectively. Samples were analyzed using a DNA-500 of MULTINA (Shimadzu, Kyoto, Japan). Graph shown at the bottom indicates the ratio of band intensity of GAD3 to that of TBP2. SM shows a DNA size maker. ND: not detected

