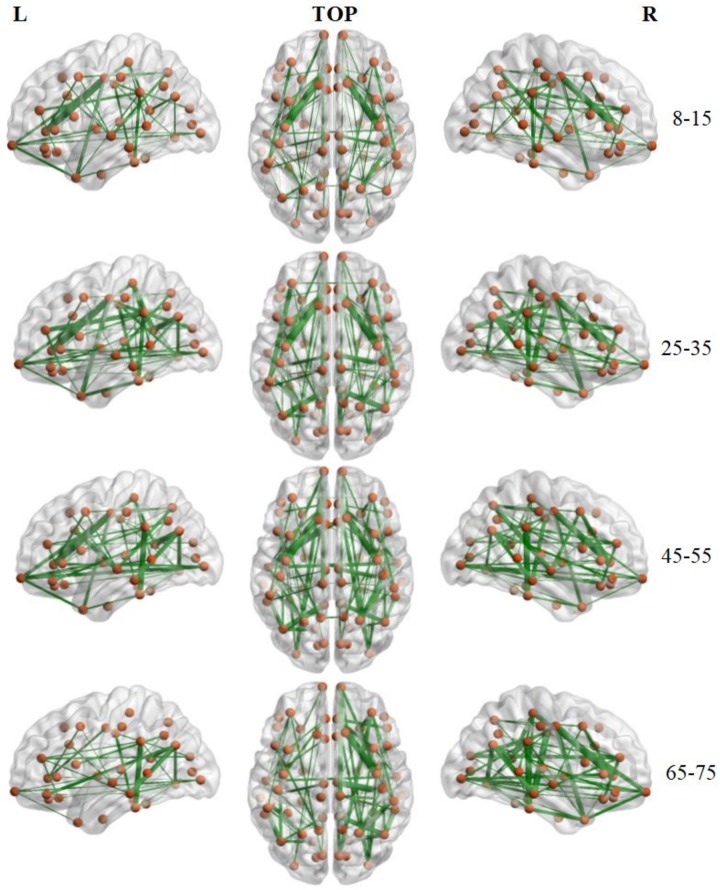
FIGURE 7.
Backbone connections of brain structural connectivity networks of four groups at the strength threshold of 0.21. The links were mapped into the brain at the left, top, and right views. The edge widths represent the connection weights between nodes. The brain graphs were visualized by using BrainNet Viewer software (Xia et al., 2013).

