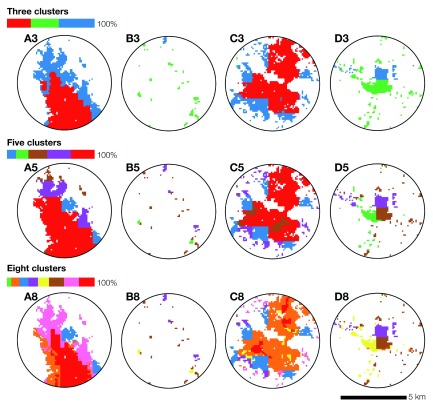
Figure 5. The spatial distribution of three, five and eight clusters for selected locations.
The legends show the ratio of settled cells allocated to the different clusters. Overall, the spatial patterns resulting from the three scenarios produce comparable outputs, with a clear distinction between the urban (Boma — A) and suburban (outskirts of Kinshasa — C) areas versus the town (Mbankana — D) and rural area (North of Kimpese — B).

