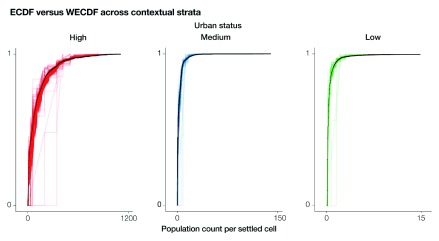
Figure 7. Empirical cumulative distribution function (ECDF) and weighted ECDF (WECDF).
The ECDFs are depicted as black lines and the ECDFs as coloured lines. Sample sizes for the ECDFs span between 1 and 1000. The settled cells are selected using proportional to population size sampling for each contextual stratum (high, medium, and low urban status), independently.

