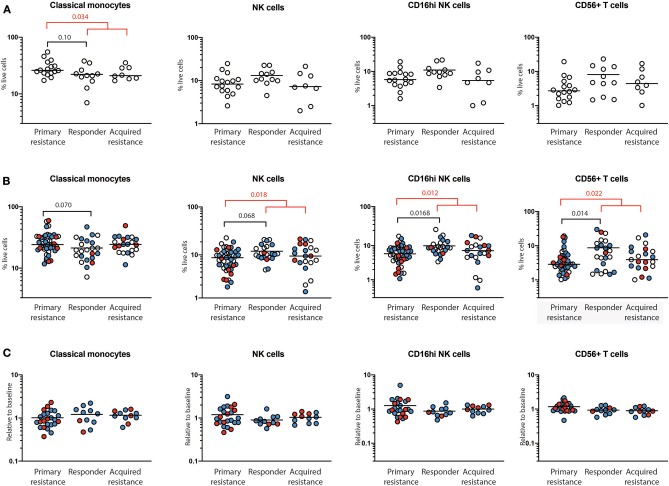
Figure 3.
Quantification of immune cells populations using mass cytometry. PBMCs from primary resistance, responder and acquired resistance groups were analyzed for multiple T cell, B cell, NK cell, and myeloid populations, as illustrated in Supplementary Figures 2, 3. Only populations that differed between groups are shown. (A) Frequencies of baseline cell populations in each of the groups. Each individual sample is indicated by a circle, with the group mean shown as a bar. (B) Frequencies of cell populations from all timepoints in each of the groups. Baseline, open circles; week 6, blue filled circles; 1 year, red filled circles. (C) Changes in frequencies within individual subjects over time. Values at 6 weeks, expressed as a proportion of baseline values, are indicated by blue filled circles while values at year 1, expressed as a proportion of baseline values, are indicated by red filled circles. Differences in frequencies of immune cell populations between primary resistance, responder, and acquired resistance groups were assessed using ANOVA followed by Tukey's multiple comparisons test and p-values are shown in black. Differences between primary resistance and primary responder (i.e., pooled responder and acquired resistance) groups were assessed using an unpaired t-test and p-values are indicated in red. Where no p-values are indicated, the relevant tests indicated p > 0.05.

