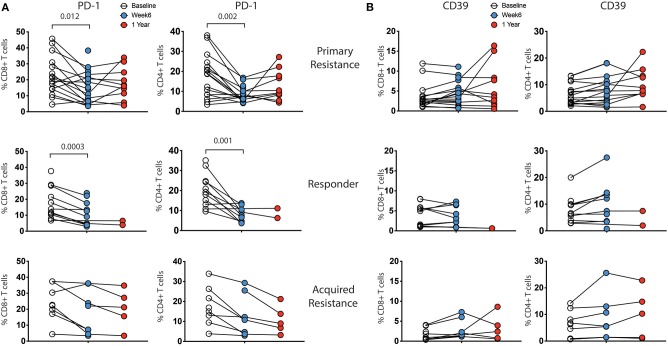
Figure 4.
Expression levels of inhibitory receptors on CD4 and CD8 T cells by treatment outcome. PBMCs were analyzed for expression of CD39, PD-1, TIGIT, TIM-3, and KLRG1 on CD4 and CD8 T cells. There were no significant differences in expression between the groups at any timepoint. Expression of (A) PD-1 and (B) CD39 showed changes within individual subjects over the course of therapy, while TIM-3, TIGIT, and KLRG1 did not (not shown). Baseline, open circles; week 6, blue filled circles; 1 year, red filled circles. Differences in frequencies of immune cell populations between the 3 timepoints were assessed using a repeated measures mixed effects analysis followed by Tukey's multiple comparisons test and p-values are indicated.

