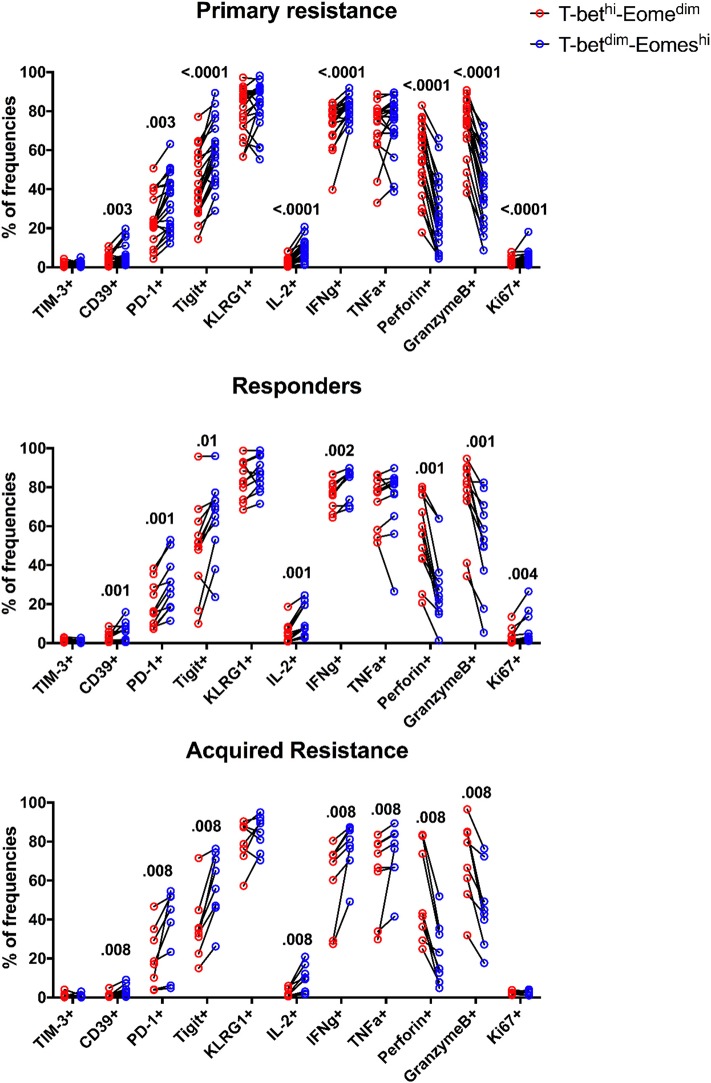
Figure 6.
Expression patterns of inhibitory receptors and cytokines on different subsets of CD8 T cells. The frequency of TIM-3, CD39, PD-1, TIGIT, KLRG1, IL-2, IFNγ, TNFα, Perforin, GranzymeB, and Ki-67 expressing cells within total T-betdimEomeshi (blue) and T-bethiEomesdim (red) CD8 T cells for all baseline samples. Statistical analysis was performed with a Wilcoxon matched-pairs single rank test.

