FIGURE 4.
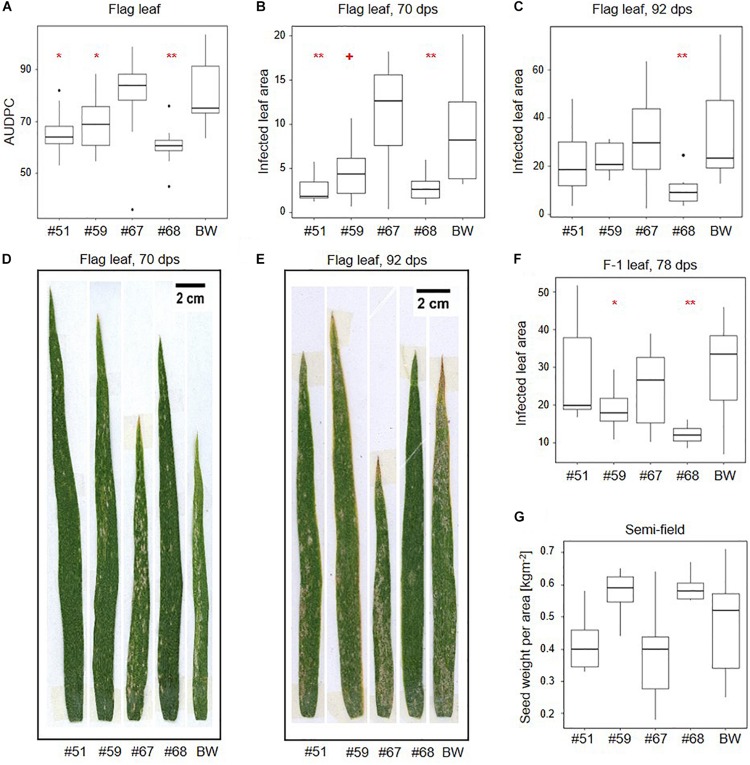
SvrPm3a1/f1-RNAi wheat lines show quantitative adult plant resistance in semi-field conditions. Transgenic events and wild-type Bobwhite (BW) were exposed to natural B.g. tritici infection in a semi-field trial. (A) Disease was monitored over time on the flag leaves and the area under the disease progression curve (AUDPC) was calculated. (B–F) Image-based quantification of the infected leaf area in flag and F-1 leaves. (B,D) At the beginning of flag leaf infection, 70 days post sowing (dps). (C,E) At the end of the B.g. tritici disease progression, 92 dps. (F) F-1 leaves at 78 dps. (G) Quantification of seed weight per area. Pairwise comparison of transgenic events with wildtype BW were carried out using one-sided t-test (A), Welch t-test (C,F,G) or Wilcoxon rank sum test (B) depending on the distribution and variance of the data. + < 0.06; *p < 0.05; **p < 0.01.

