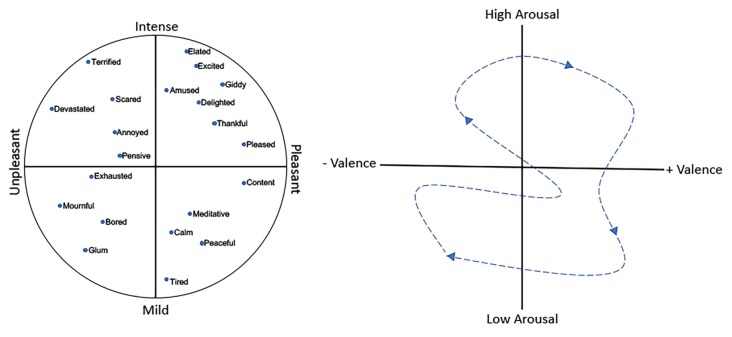
Figure 1.
(Left) An example of a two-dimensional emotion plot including intensity and valence dimensions. (Right) A representation of the temporal shift in the affective state (dashed arrow) which reflects the combination of emotion and mood. Over time, an individual expresses an emotional/mood trajectory through different states.

