Figure 6.
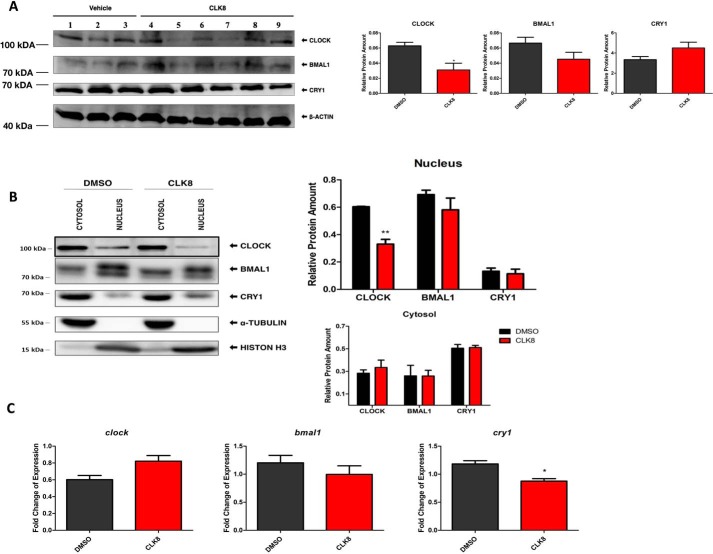
Effect of CLK8 in mice liver. A, the mice were treated with CLK8 or vehicle and then euthanized. Liver protein lysates were prepared and probed with antibodies for different core clock proteins. B, mice livers (n = 3 for vehicle-treated animals; n = 5 for CLK8-treated animals) were fractionated and the samples were subjected to Western blot analysis. Quantifications are shown in the right panel. Data are mean ± S.E.; n = 3 independent experiments for the control samples; n = 5 independent experiments for CLK8-treated samples. **, p value <0.01 by one-way ANOVA. C, transcriptional levels of Clock, Cry1, and Bmal1 were measured by qPCR. Data are mean ± S.E.; n = 3 independent for the control samples; n = 5 for CLK8-treated samples. *, p value <0.05. The lane numbers 1, 2, and 3 indicate the animals used as the controls (treated with vehicle); lanes 4, 5, 6, 7, 8, and 9 indicate the animals treated with CLK8.

