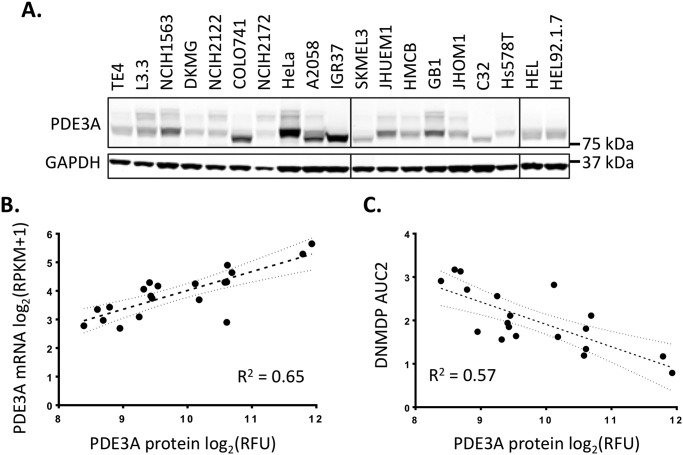
Figure 4.
A, immunoblot measuring PDE3A protein expression across biomarker-positive cell lines. B, correlation between PDE3A RNA expression, as measured by CCLE RNA-Seq, and PDE3A protein expression, as measured by LI-COR quantification of the immunoblot in A. The 95% confidence interval of the best-fit line is indicated. C, correlation between PDE3A protein expression and DNMDP response (AUC2 from Table S1). The 95% confidence interval of the best-fit line is indicated. RFU, relative fluorescence units.

