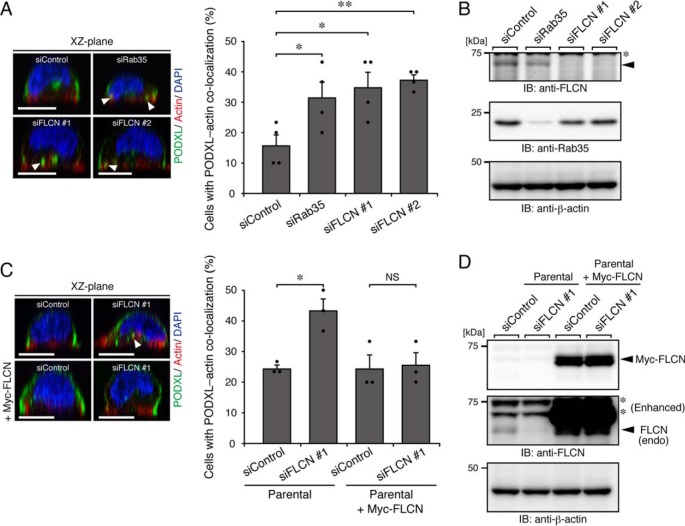
Figure 6.
FLCN regulates PODXL trafficking under 2D culture conditions. A, parental cells that had been transfected with control siRNA (siControl), siRNAs against Rab35 (siRab35), or FLCN (two independent target sites: #1 and #2) (siFLCN) were plated on glass-bottom dishes and fixed at 3 h after plating, followed by counting of cells with co-localized PODXL and actin (30 cells/condition). The arrowheads show PODXL co-localizing with actin. Scale bars, 10 μm. The graph shows the means and S.E. (error bars) of four independent experiments. *, p < 0.05; **, p < 0.01 (Dunnett's test). B, KD efficiency of Rab35 and FLCN as revealed by immunoblotting (IB) with anti-FLCN, anti-Rab35, and anti-β-actin antibodies. The arrowhead indicates the position of endogenous FLCN. The asterisk indicates a nonspecific band of the primary antibody. C, parental cells and Myc-FLCN–expressing cells (+Myc-FLCN) that had been transfected with control siRNA or siRNA against FLCN (#1) were plated on glass-bottom dishes and fixed at 3 h after plating, followed by counting of cells with co-localized PODXL and actin (30 cells/condition). The graph shows the means and S.E. (error bars) of three independent experiments. *, p < 0.05; NS, not significant (Tukey's test). The arrowhead shows PODXL co-localizing with actin. D, lysates of the cells used in C were analyzed by immunoblotting with anti-FLCN and anti-β-actin antibodies. Note that endogenous (endo) FLCN, but not exogenous mouse FLCN, were efficiently knocked down by the siFLCN #1. Because knockdown of endogenous FLCN in Myc-FLCN–expressing cells was not observed, presumably because of the existence of the degradation product of Myc-FLCN, the decrease of endogenous FLCN mRNA in parental and Myc-FLCN–expressing MDCK II cells that had been transfected with siFLCN#1 was also confirmed by real-time PCR analysis (data not shown). The asterisks indicate nonspecific bands of the primary antibody.

