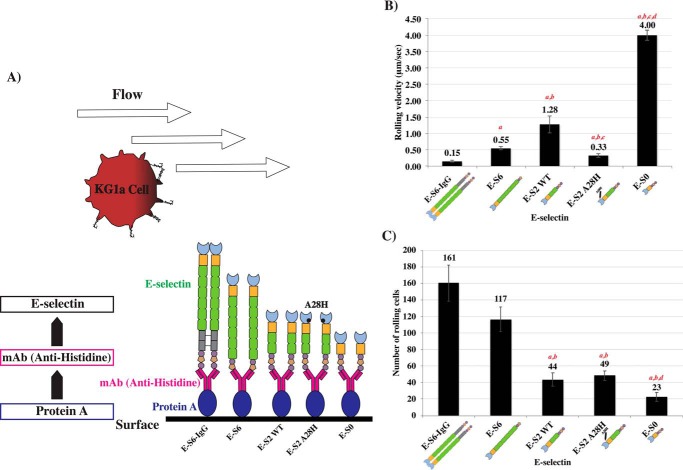
Figure 4.
Cell rolling analysis of KG1a cells on immobilized E-selectin proteins. A, schematic representation of the experimental steps involved in the microfluidics-based flow assay. To ensure the uniform immobilization of each of the proteins, identical concentrations of protein A were deposited on each channel of an uncoated μ slide VI0.1 microscopy chamber. This was followed by the addition of anti-histidine antibody and, subsequently, E-selectin proteins were introduced and captured through their C-terminal histidine tags (refer to Fig. S6: each E-selectin can be pulled down equivalently using anti-histidine). KG1a cells in perfusion buffer containing 0.5 mm Ca2+ were drawn into the E-selectin–coated channels at various shear stresses (1 dyne/cm2, 2 dyne/cm2, 3 dyne/cm2, 4 dyne/cm2, 5 dyne/cm2, and 6 dyne/cm2) for duration of 30 s each. B, adhesion bar graph of rolling velocities (μm/s) from n = 3 independent experiments, evaluating the rolling of KG1a on histidine-immobilized E-selectins in the presence of 0.5 mm Ca2+, represented as mean ± S.E.M. C, bar graph representing the number of KG1a cells rolling on each construct as an alternative measurement for adhesive strength from n = 3 independent experiments, represented as mean ± S.E.M. (n = 3; a indicates significance compared with E-S6-IgG, b indicates significance compared with E-S6, c indicates significance compared with E-S2, and d indicates significance compared with E-S2-A28H, p ≤ 0.05).

