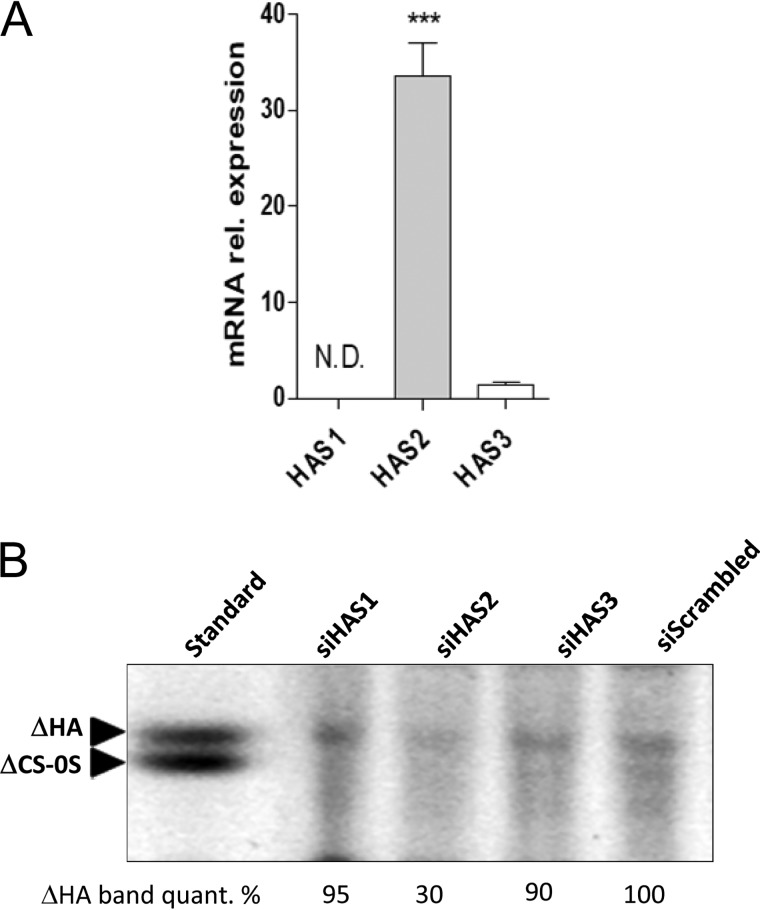
Figure 1.
HASes expression and HA synthesis in AoSMCs. A, quantitative RT-PCR analyses are shown for basal HASes mRNA levels in AoSMCs. Data are expressed as mean ± S.E. of three independent experiments. ***, p < 0.001; N.D., not determined. B, image is shown of a representative PAGEFS analysis of ΔHA and ΔCS-0S disaccharides in the culture medium of AoSMCs after the silencing of HASes. AoSMCs were transfected with 50 nm of scrambled siRNA (siScrambled) or transfected with 50 nm of each HAS siRNA. After 48 h, cell culture media were collected, and ΔHA and ΔCS-0S were analyzed by PAGEFS. The quantification of the bands was done by measuring their optical density using the ImageJ software.

