Figure 7.
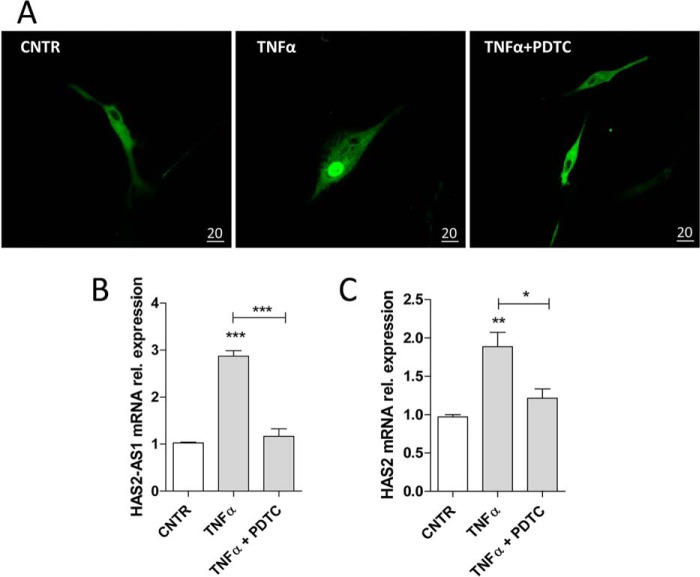
NF-κB blockade influences HAS2–AS1 expression. A, confocal microscopy images are shown for AoSMCs seeded on coverslips, nucleofected with 4 μg of pcDNA3-GFP-RelA, and treated with 0.1 μg/ml TNFα alone or in combination with 10 μm PDTC (×63 objective). Bars, 20 μm. Quantitative RT-PCR analyses are shown for HAS2–AS1 (B) and HAS2 (C) expression of AoSMCs treated with 0.1 μg/ml TNFα alone or with 10 μm PDTC for 24 h. Data are displayed as mean ± S.E. of three independent experiments. *, p < 0.05; **, p < 0.01; ***, p < 0.001; CNTR, control.

