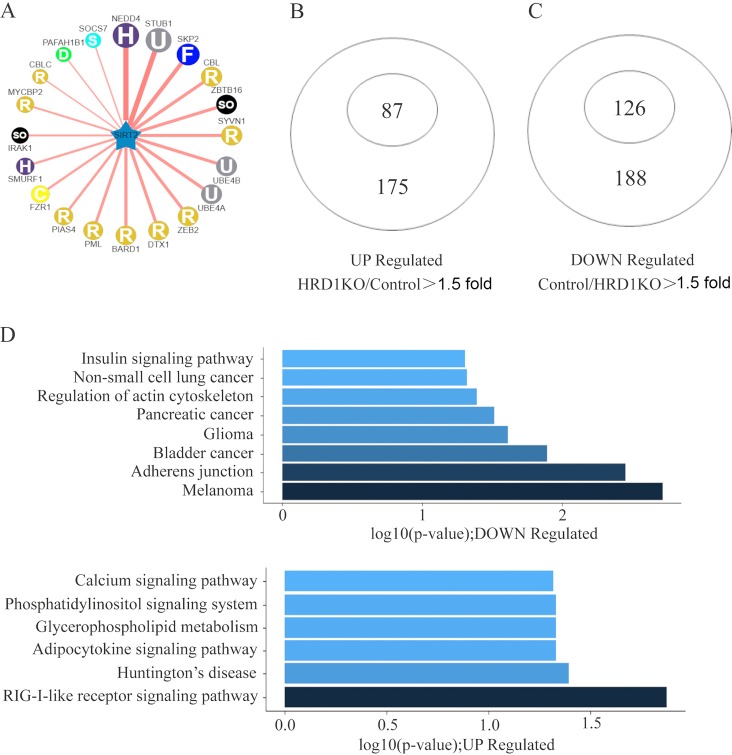
FIG 1.
HRD1 deficiency upregulated the expression of SIRT2 as determined using mass spectrometry analysis. (A) The network view of the predicted E3 ligase of SIRT2 by UbiBrowser. The query substrate is located in the center of the canvas. The predicted E3 ligases surround the substrate. The node colors and characters reflect the E3 type. The edge width, the node size, and the edge shade are corrected with the confidence score. Node size, edge color depth, and edge width are proportional to the confidence score. H, HECT; U, UBOX; F, F-box; R, RING; C, CDC20; D, DWD; S, SOCS. (B and C) Proteomic analysis of genes differentially expressed between control and HRD1 knockout A549 cells. Diagrams depict 87 HRD1-repressed genes and 126 HRD1-activated genes. (D) Representative showing of HRD1-activated and -repressed genes by KEGG analysis.

