
9.
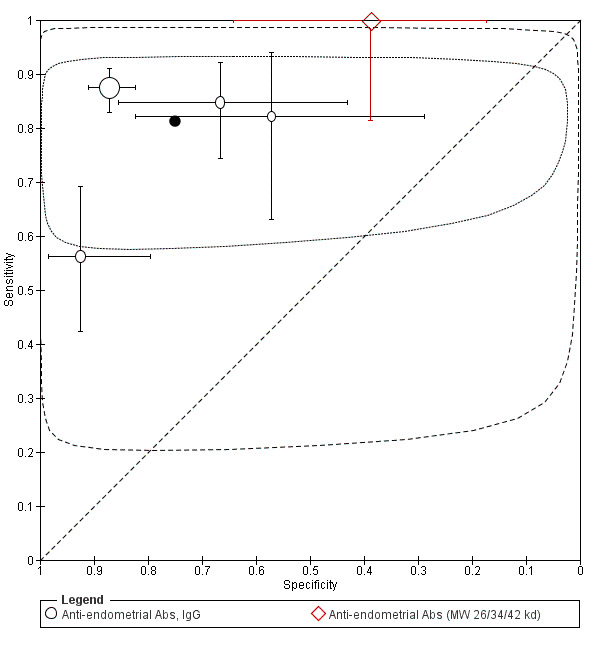
Summary ROC plot of anti‐endometrial Abs, IgG for detection of endometriosis. Each point represents the pair of sensitivity and specificity from each evaluation. The size of each point is proportional to the sample size and the shape designates the tests with different sets of antibodies tested. The bars correspond to 95% CIs of each individual evaluation. The solid black circle represents the mean sensitivity and specificity, which is surrounded by a 95% confidence region (dotted line) and by 95% prediction region (dashed line). Meta‐analysis was performed for 4 studies (the data for Anti‐endometrial Abs (MW 26/34/42 kd) were not included, considering it as a separate test).