
10.
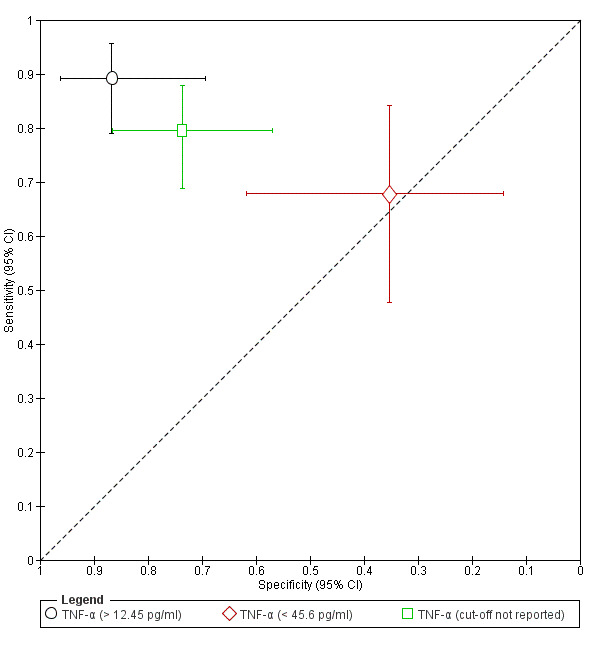
Summary ROC plot of TNF‐α for detection of endometriosis. Each point represents the pair of sensitivity and specificity for each evaluation. The size of each point is proportional to the sample size and the shape designates the tests with different cut‐off values. The bars correspond to 95% CIs of each individual evaluation. The data were not assessed by meta‐analysis.