
24.
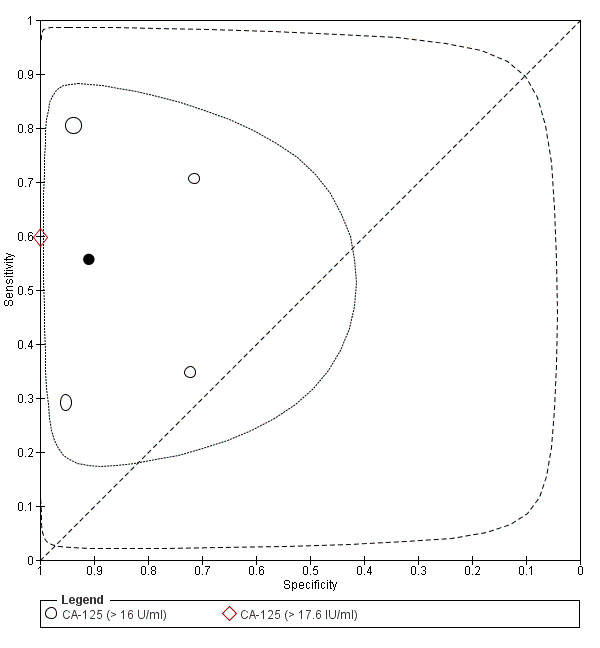
Summary ROC plot of CA‐125 with cut‐off values ranging > 16‐17.6 U/ml for detection of endometriosis. Each point represents the pair of sensitivity and specificity from each evaluation. The size of each point is proportional to the sample size and the shape designates the tests with different cut‐off values. The solid black circle represents the mean sensitivity and specificity, which is surrounded by a 95% confidence region (dotted line) ad by 95% prediction region (dashed line).