
30.
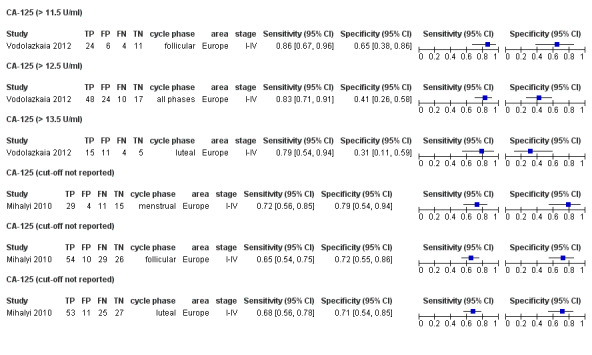
Forest plot of direct comparisons of CA‐125 for detection of endometriosis performed between different phases of menstrual cycle in 2 separate studies. Plot shows the estimates of sensitivity and specificity (squares) with 95% CI (black line) specific for each evaluation, country in which the study was conducted, menstrual cycle phase at which the test was performed and severity of the disease assessed by each study, reported as rASRM stage. The studies are ordered according to the study names. FN: false negative; FP: false positive; TN: true negative; TP: true positive.