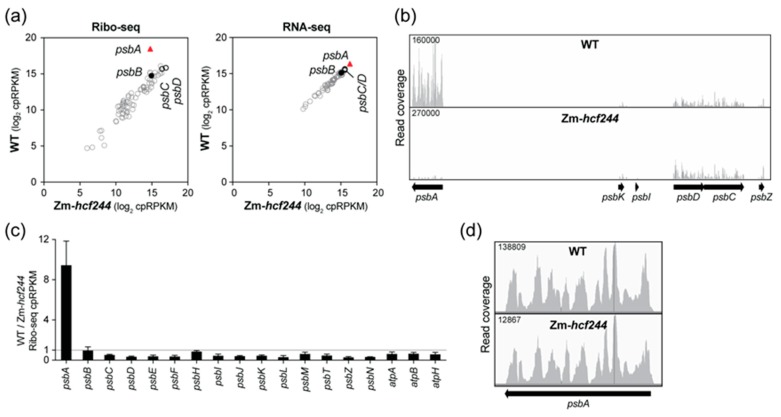
Figure 2.
Analysis of chloroplast gene expression in the Zm-hcf244 mutant by Ribo-seq and RNA-seq. Results from a replicate experiment are shown in Figure S1a. (a) Comparison of ribosome footprint abundance (Ribo-seq) and RNA abundance (RNA-seq) for all chloroplast genes in the Zm-hcf244 mutant and its phenotypically-normal sibling (WT). Each symbol represents one gene. Values are expressed as reads per kilobase in the ORF per million reads mapped to chloroplast ORFs (cpRPKM). (b) Screen capture from the Integrated Genome Viewer (IGV) showing the distribution of ribosome footprints along psbA and adjacent ORFs in the wild-type and Zm-hcf244 mutant. The Y-axis shows the number of reads at each position (not normalized); the maximum Y-axis values are shown in the upper left, and were chosen such that peak heights in psbD and psbC were similar in the two samples. (c) Ratio of Ribo-seq reads in the wild-type relative to the mutant for chloroplast genes encoding PSII subunits. Several atp genes are shown for comparison. The average of the two replicates (+/– SD) is shown. (d) Distribution of ribosome footprints along the psbA ORF. The Y-axis maxima were adjusted to facilitate comparison of ribosome distributions in the two genotypes.

