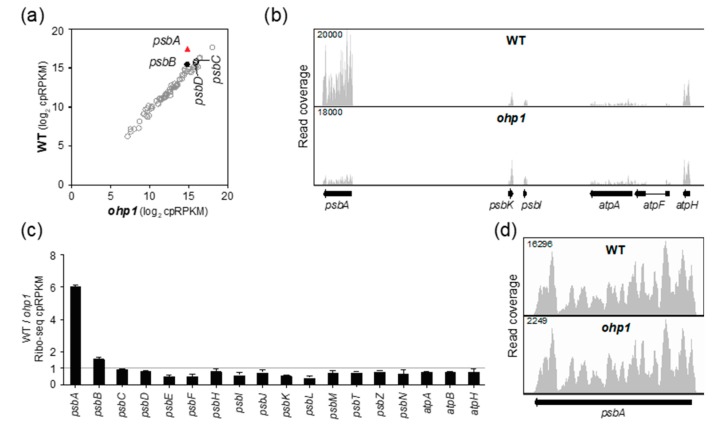
Figure 3.
Ribo-seq analysis of Arabidopsis ohp1 mutants. Data for a replicate experiment are shown in Figure S1b. Symbols and nomenclature are as described in Figure 2. (a) Comparison of ribosome footprint abundance for all chloroplast genes in ohp1 mutants to that in phenotypically-normal siblings. (b) Screen capture from the Integrated Genome Viewer (IGV) showing the distribution of ribosome footprints along psbA and adjacent ORFs. Different genes are displayed here and in Figure 2b due to the different gene order in the maize and Arabidopsis chloroplast genomes. (c) Ratio of Ribo-seq reads in the wild-type relative to the mutant for chloroplast genes encoding PSII subunits. Several atp genes are shown for comparison. The average of the two replicates (+/– SD) is shown. (d) Distribution of ribosome footprints along the psbA ORF. The Y-axis maxima were adjusted to facilitate comparison of ribosome distributions in the two genotypes.

