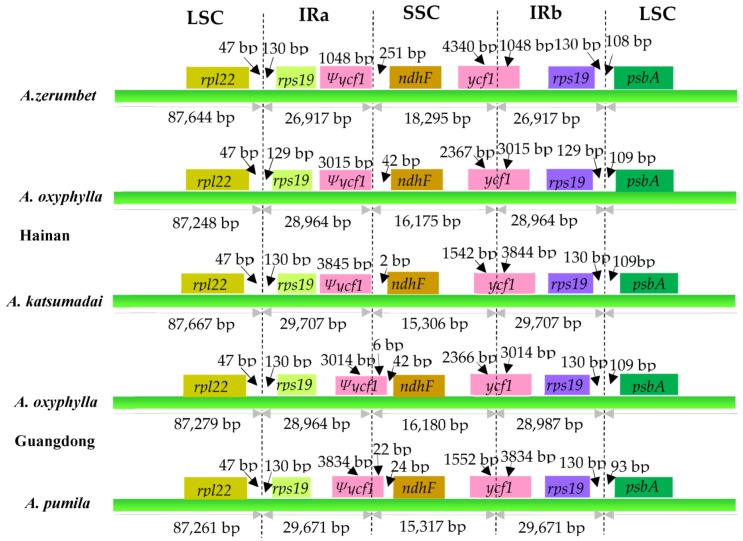
Figure 5.
Comparison of the borders of the LSC, SSC, and IR regions among five Alpinia chloroplast genomes. Ψ, pseudogenes. Boxes above the main line indicate the adjacent border genes. The figure is not to scale with respect to sequence length, and only shows relative changes at or near the IR/SC borders.

