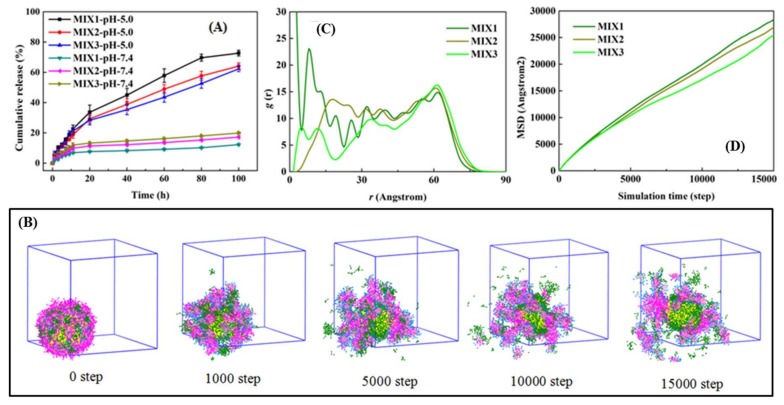
Figure 7.
In vitro drug release profiles (A) at pH 7.4 and pH 5.0; (B) DOX release process of MIX1 (LC, 31.23%) in acidic aqueous solution; (C) radial distribution functions (RDF) curves between DOX and the micellar center; (D) mean square displacements (MSD) curves of the DOX-loaded mixed micelles MIX1 (LC, 31.23%), MIX2 (LC, 26.53%), and MIX3 (LC, 23.36%).

