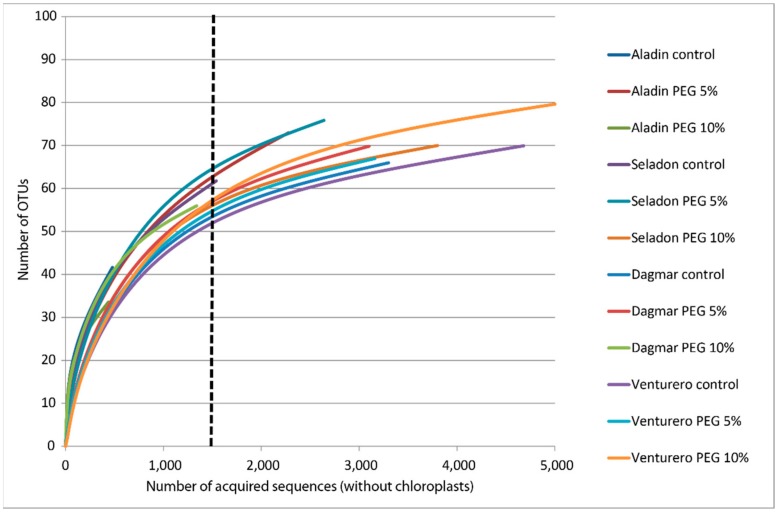
Figure 1.
Rarefaction curves of microbial clusters in the microbiomes of different wheat varieties cultured in vitro. Rarefaction curves were assembled showing the number of operational taxonomic units defined at a 97% sequence similarity, relative to the number of total sequences. The dashed vertical line indicates the number of sequences subsampled from each sample to calculate the alpha diversity estimates.

