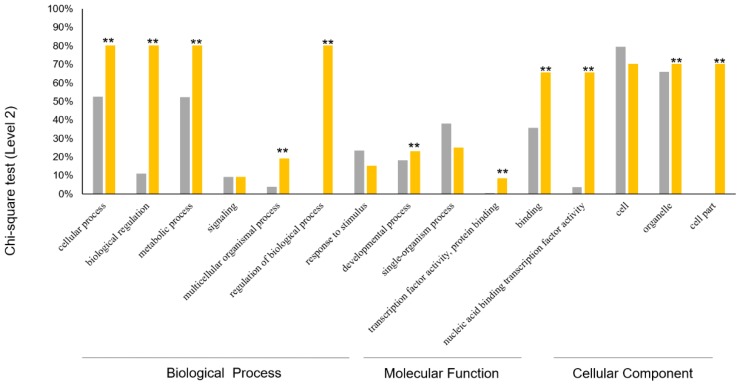
Figure 6.
The Chi-square test was used to calculate the prediction and actual situation of the same function (Level 2) of the PgGRAS genes, further embodying the differentiation diversity of the PgGRAS genes function. Gray, the control group. Yellow, the PgGRAS genes group. **, very significant (p ≤ 0.01).

