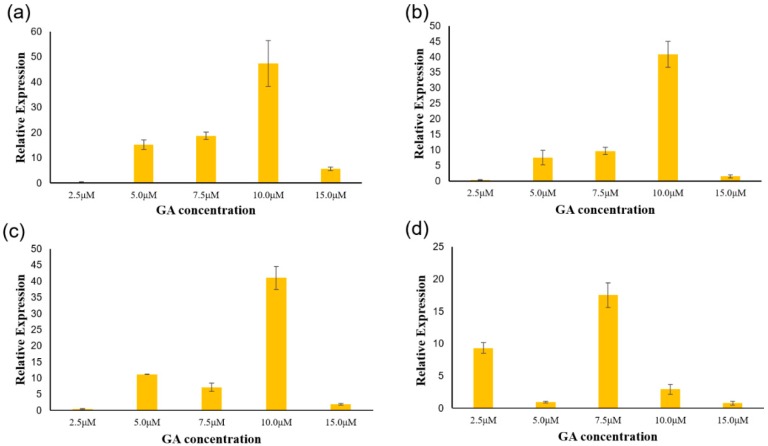
Figure 8.
Relative expression levels of PgGRAS genes in different concentration GA treatments by qPCR. (a) Expression of PgGRAS44-04 after GA treatment at different concentrations. (b) Expression of PgGRAS48-01 after GA treatment at different concentrations. (c) Expression of PgGRAS50-01 after GA treatment at different concentrations. (d) Expression of PgGRAS68-01 after GA treatment at different concentrations. The expression level of the control sample was normalized to one. Error bars show the standard error between three replicates performed.

