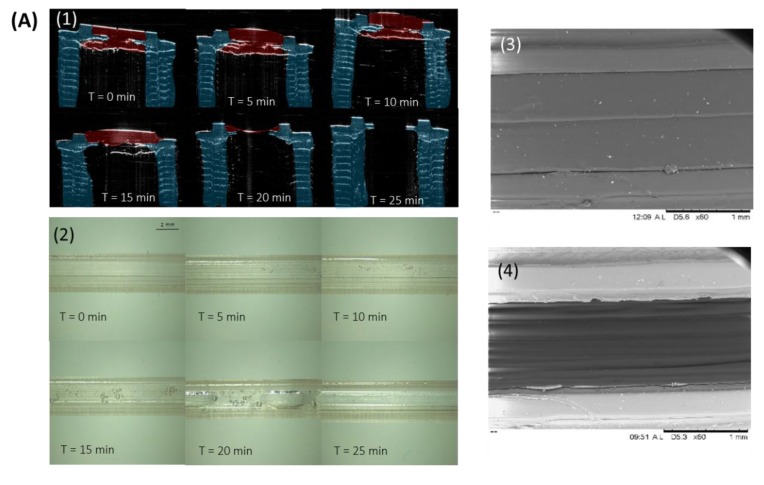
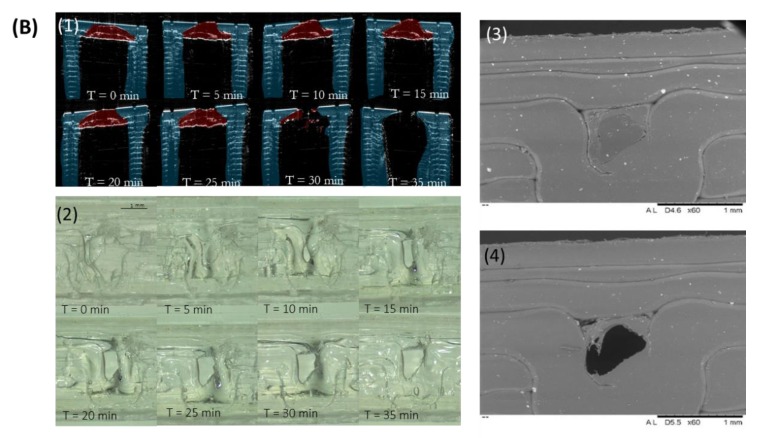
Figure 4.
(A) Implant B (1) OCT images of poly(vinyl alcohol) (PVA) membrane dissolution in Implant B after emersion in phosphate buffered saline (PBS); (2) digital microscope images of poly(vinyl alcohol) (PVA) membrane dissolution in Implant B after emersion in PBS; SEM images of Implant B (3) before and (4) after dissolution. (B) (1) OCT images of poly(vinyl alcohol) (PVA) membrane dissolution in Implant E after emersion in PBS; (2) digital microscope images of poly(vinyl alcohol) (PVA) membrane dissolution in Implant E after emersion in PBS; SEM images of Implant E (3) before and (4) after dissolution.


