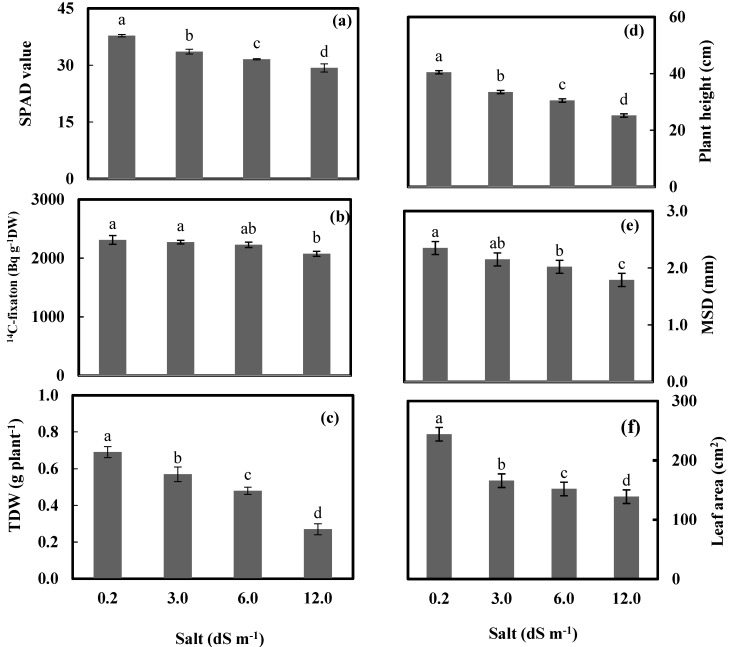
Figure 2.
Relative chlorophyll content measured by SPAD meter (SPAD value) (a), 14C–fixaton in Bq g−1 DW (b), total dry weight (TDW) (c), plant height (d), main stem diameter (MSD) (e), and leaf area plant−1 (f) of wheat plants after subjecting at 0.23, 3.0, 6.0, and 12.0 dS m−1 salt stress for 56 days. Bars represent standard errors. Different letters along with salt treatments indicate significant differences in access treatment means from 6 replications measured at p ≤ 0.05 according to Duncan’s multiple range test.

