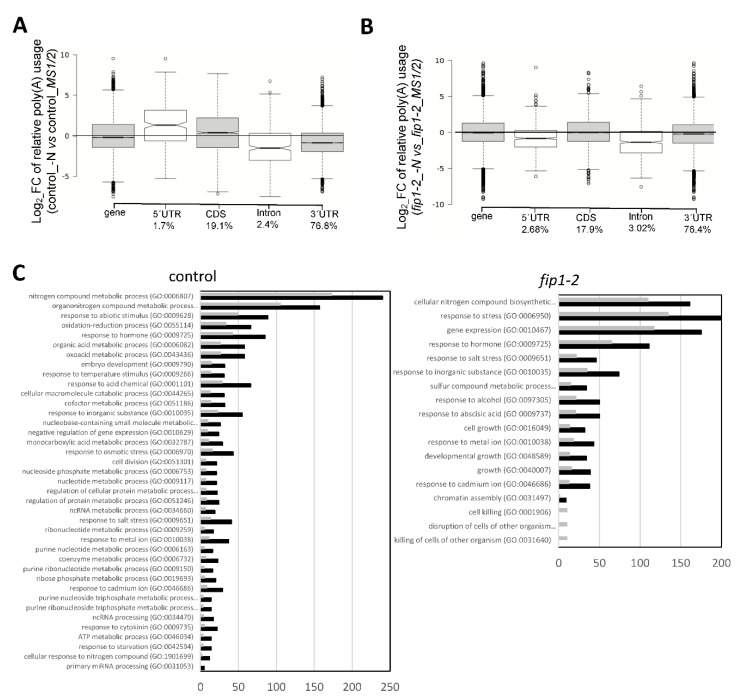
Figure 2.
Genome-wide distribution of poly(A) site usage in response to nitrogen starvation and mediated by FIP1. Box plots showing change in usage of different classes of poly(A) sites. For this, the relative contribution that each poly(A) cluster (PAC) makes to total poly(A) usage was determined on a gene-by-gene basis, with the ratios of usage in nitrogen starved roots in control seedlings (A) or in fip1-2 (B) calculated and log2-transformed. “Gene” represents the complete collection of PACs analyzed. Bottom percentage indicates the relative number of PACs in each locus position. (C) Gene ontology analyses of genes showing APA in control or fip1-2 in response to N deficiency in roots with FDR <0.05 and a fold enrichment >2. Grey bars correspond to expected number of genes and black bars to observe number. For full list of GO categories, see Table S1.

