Figure 5.
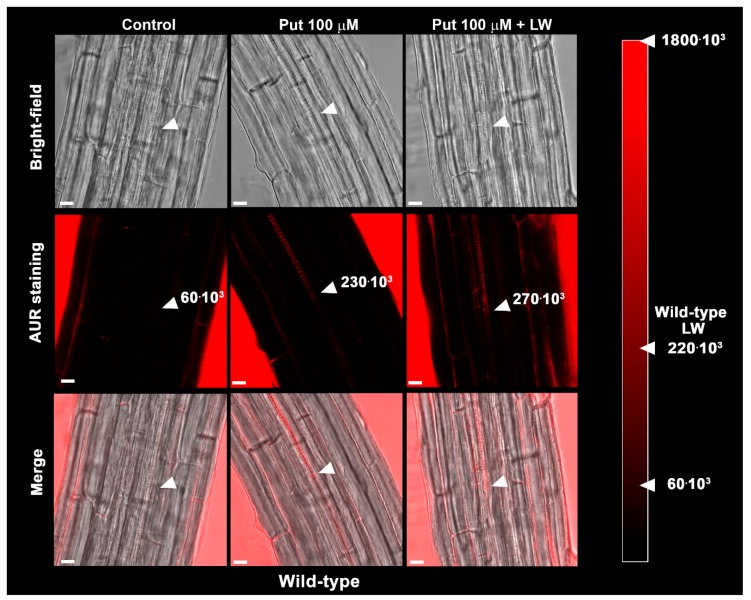
In situ H2O2 detection by LSCM analysis, after AUR staining, of roots from 7-day-old unwounded Put-untreated control (Control), unwounded Put-treated (Put 100 µM) and leaf-wounded Put-treated (Put 100 µM + LW) WT seedlings. Treatment with 100 µM Put was performed 6 h after the injury. The corresponding bright-field and overlay images are shown. Micrographs show the root zone corresponding to the site of appearance of the first protoxylem cell with fully developed secondary cell wall thickenings (arrows) and have been taken at the level of the central root section. Images are representative of those obtained from ten seedlings from three independent experiments. The average values of fluorescence intensity measured as the sum of the pixels of each of five 65 μm2 rectangle are reported for each condition (mean values ± SD; n = 25). The maximum pixel sum for a completely saturated square was approximately 1800 × 103. In the red degrading scale are reported for comparison the average values of fluorescence intensity for leaf-wounded (Put-untreated) WT plants, respectively, were 60 × 103 ± 19 × 103 and 220 × 103 ± 38 × 103 (data from [10]). Bars: 10 μm.

