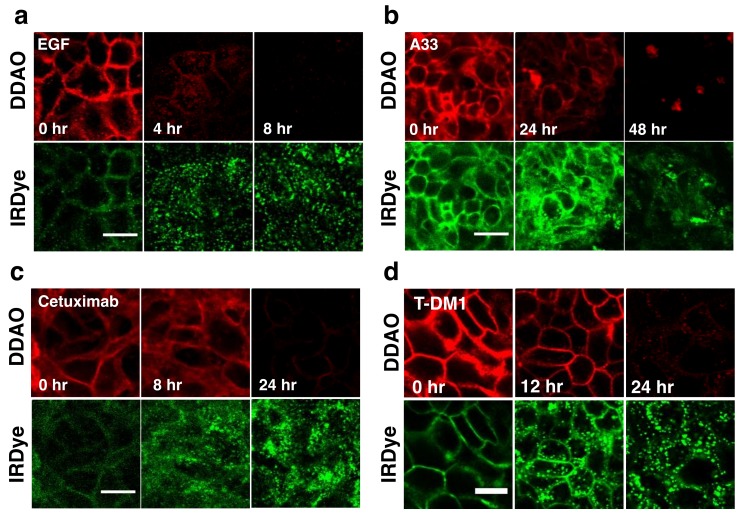
Figure 3.
In vitro confocal microscopy of dually labeled (a) EGF, (b) A33, (c) Cetuximab, and (d) T-DM1. DDAO (red) shows cell surface labeling with a loss of signal over time. IRDye (green) shows initial cell surface labeling followed by the formation of punctate spots as it is trapped in the lysosomes. Scale bar is 10 µm.

