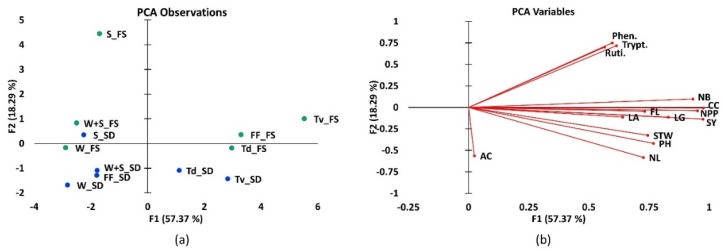
Figure 2.
Two-dimensional principal component analysis (PCA) of (a) treatments applied using foliar spray and soil drench methods. Green marks indicate the treatments applied using foliar spray (FS) while blue marks indicate the application by soil drench (SD) where Tv = T. vogelii; Td = T. diversifolia; FF = foliar spray; W = water only; W + S = water and soap; S = synthetic; and (b) the covariance among all growth and metabolite parameters where CC = Chlorophyll content; FL = Flavonoids; AN = Anthocyanins; PH = Plant height; NL = Number of leaves; NB = Number of branches; LA = Leaf area; SW = Stem width; LG = Leaf greenness; NPP = Number of pods per plant; and SY = seed yield/plant.

