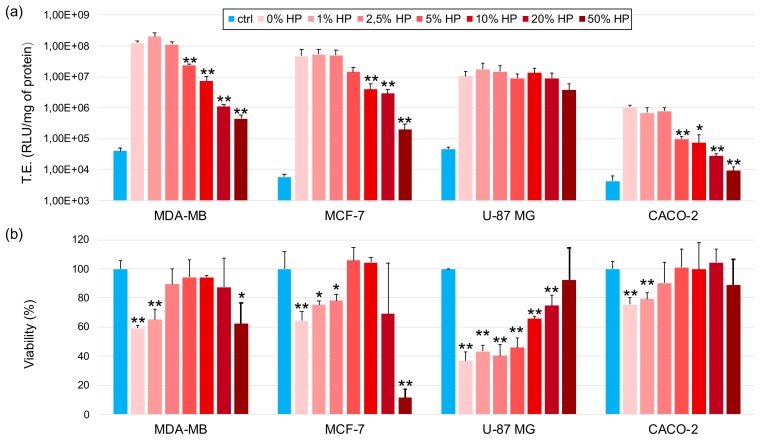
Figure 4.
Transfection efficiency (TE, panel a) and cell viability (panel b) of biocoronated grapholipoplexes at different plasma concentrations in MDA-MB, MCF-7, U-87 MG and CACO-2 cells. Untreated cells (blue bars) were used as a control (ctrl) in both experiments. Results are given as average of six independent measurements ± S.D. Statistical significance was evaluated using Student’s t-test (* p < 0.05; ** p < 0.01; no asterisk means lack of significance) with respect to pristine grapholipoplexes (i.e., 0% HP) and untreated cells in TE and cell viability experiments, respectively.

