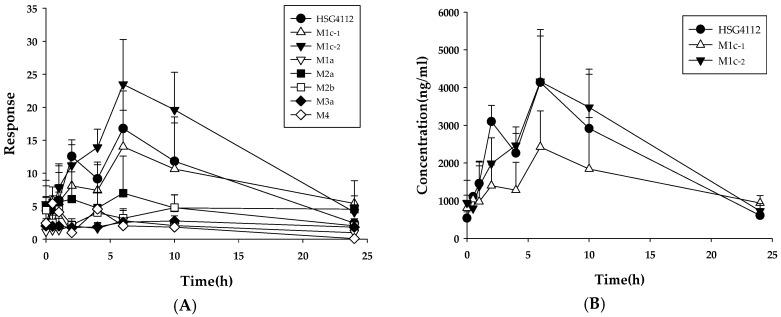
Figure 8.
Metabolic profiles of HSG4112 in rat plasma after oral administration (100 mg/kg/day, 28th day, n = 3). (A) Plot for time-peak area of HSG4112 and its metabolites. (B) Plot for time-plasma concentration of HSG4112, M1c-1 and M1c-2. (C) Area under curve values of HSG4112 and its metabolites calculated from (A).


