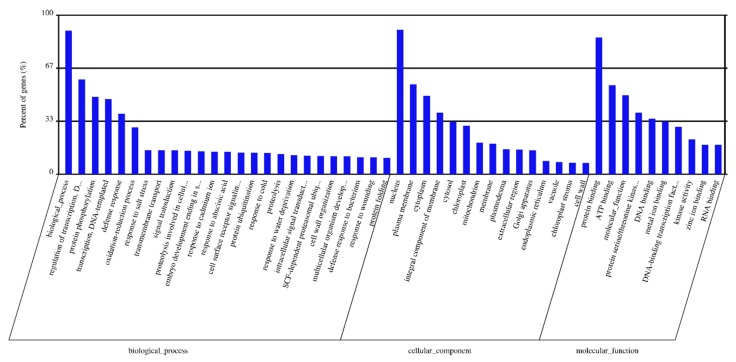
Figure 5.
The most represented Gene Ontology terms among the predicted targets in three categories. GO terms were shown for each category based on the number of genes matched for each GO term (from higher to lower). Percent of genes (%) indicates the percentage of the gene number matched for each GO among the total number of genes within each category.

