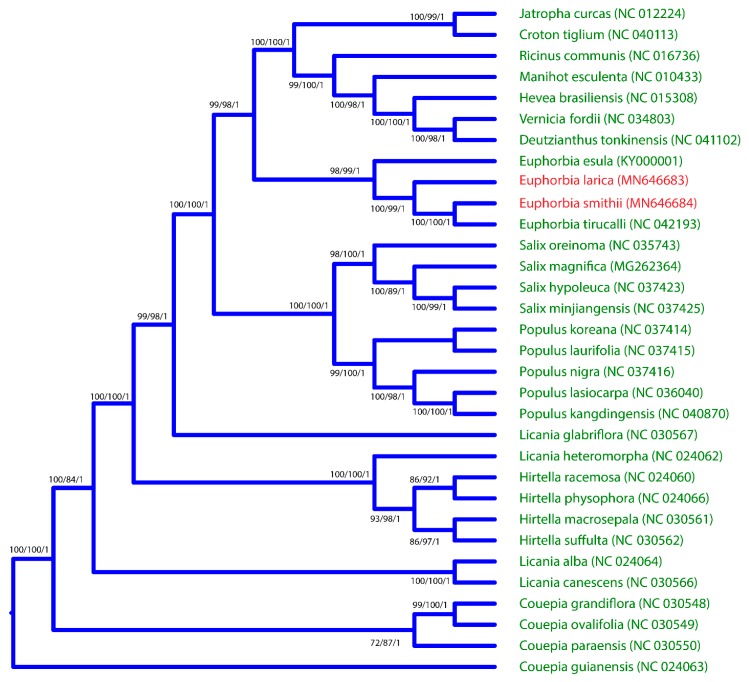
Figure 6.
Phylogenetic trees of E. smithii and E. larica. The entire genome dataset was analyzed using three different methods: Bayesian inference (BI), maximum parsimony (MP), and maximum likelihood (ML). Numbers above the branches represent bootstrap values in the ML and MP, and posterior probabilities in the BI trees. Red color represents the positions of E. smithii and E. larica.

