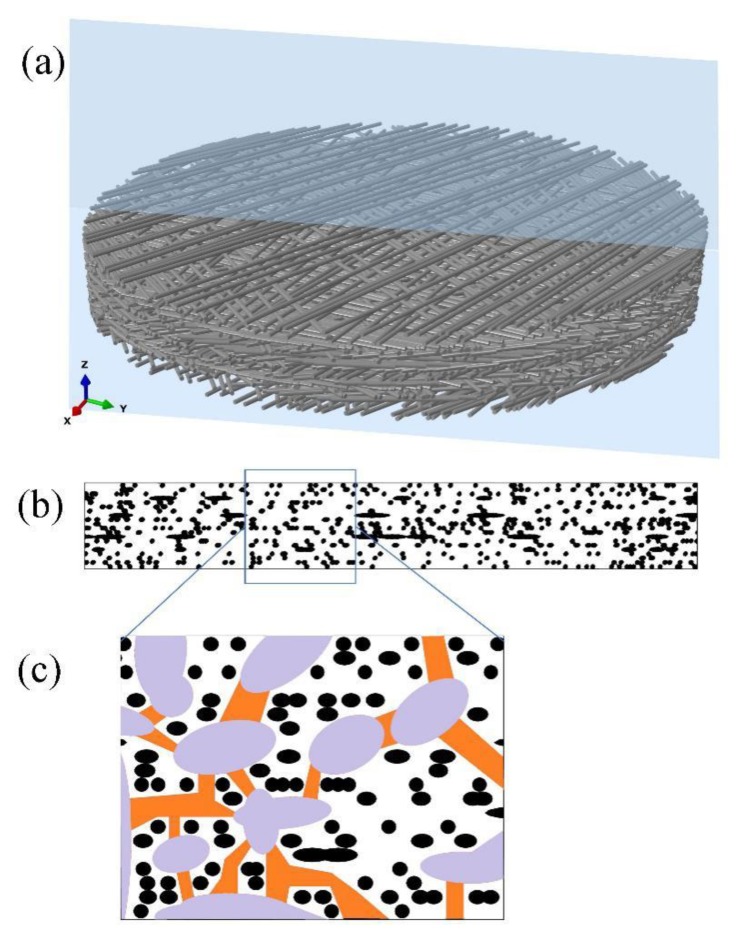
Figure 2.
Three-dimensional reconstruction images of intervessel pit membrane. (a) A general view of intervessel pit membrane showing multiple layers of randomly distributed cellulose microfibrils. The blue slide shows direction of splitting in the radial view assuming pit membranes are circular. (b) Cellulose microfibril distribution of pit membrane in Figure 2a from the radial view, and black shapes represent cellulose microfibrils. (c) An enlarged view from the frame shown in Figure 2b, with pit membrane constriction illustrated. Black shapes represent cellulose microfibrils; purple shapes represent relatively larger pores in between cellulose microfibrils, and orange shapes represent constrictions between these relatively larger pores.

