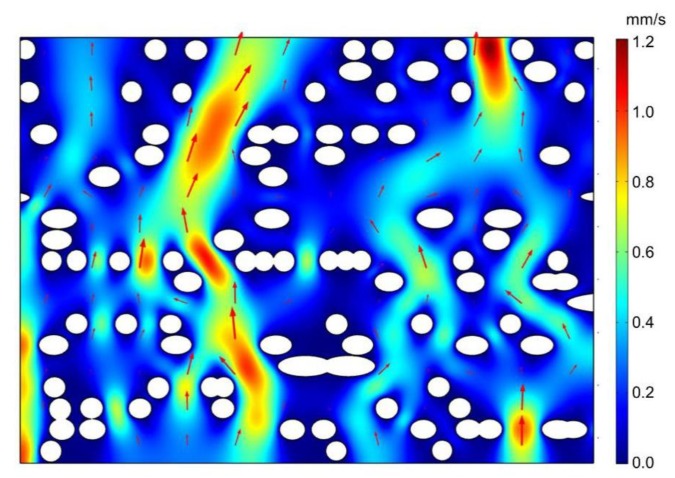
Figure 3.
Flow velocity across intervessel pit membrane of angiosperm xylem from microfluid flow simulation. The fluid density was set to 998 kg/m3 with a dynamic viscosity, , of 10−3 Pa s, corresponding to the properties of water at 20 ℃. The pressure between the top and bottom surface was 1000 Pa in this example. White circles represent cellulose microfibril. Red region represents faster flow rate while blue region represents slower flow rate. Arrows represent velocity vector.

