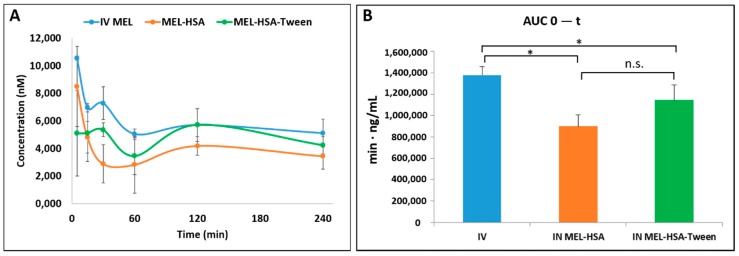
Figure 8.
Plasma drug concentration vs. time profiles in rats after intravenous (IV) MEL and intranasal (IN) administration of MEL-albumin nanoparticles (A) and their area under the curve (AUC) value (B). Statistical analysis: t-test. * p < 0.05, n.s. means not significant compared to IV MEL control.

