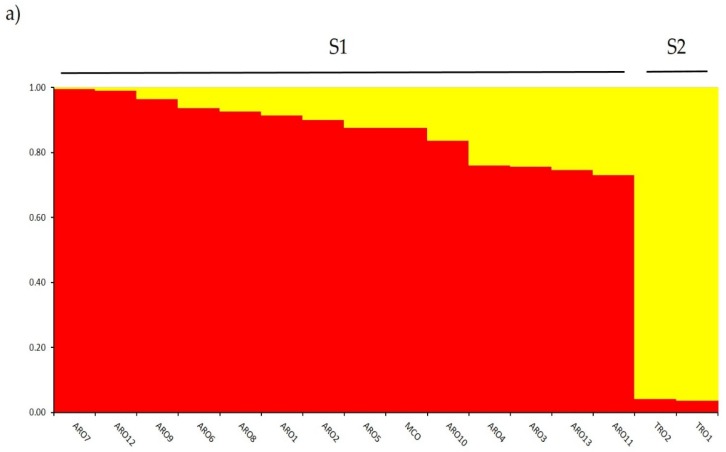
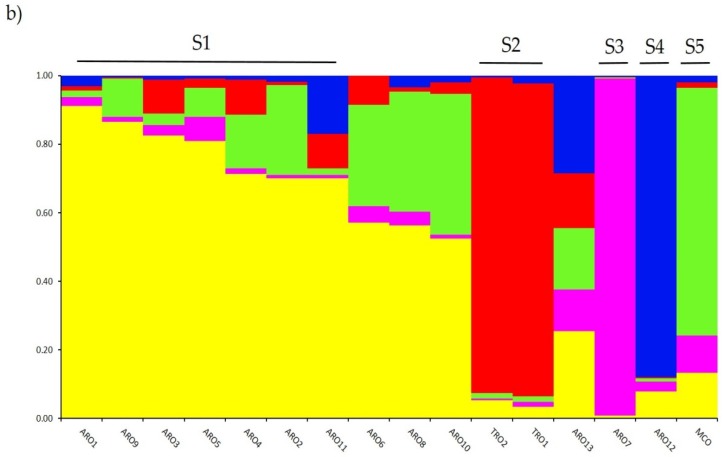
Figure 2.
Estimated structure of the Allium cepa germplasm collection characterized in this study. Results are shown for K = 2 (a) and K = 5 (b). The y-axis indicates the estimate membership coefficient (q). Each of the 16 onion populations is represented by a single vertical bar, which is partitioned into colored segments in proportion to the estimated membership coefficient in each of 2 (a) and 5 (b) clusters.


