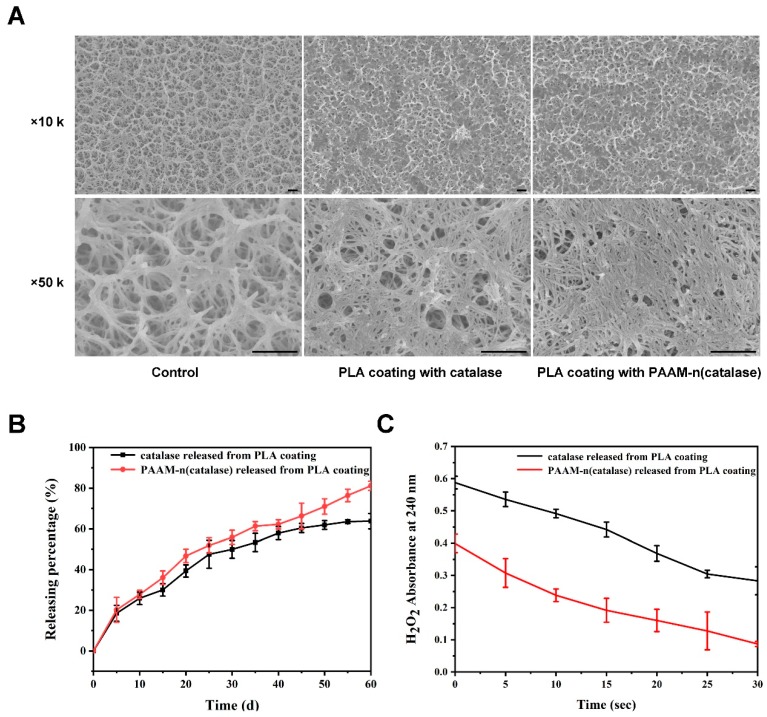
Figure 5.
(A) The representative SEM images of a titanium dioxide plate and a PLA-coated titanium dioxide plate; the bar was 500 nm; (B) the release profiles of native catalase and PAAM-n(catalase) from the PLA coating; (C) the activity of released catalase was tested by the degradation kinetics of H2O2.

