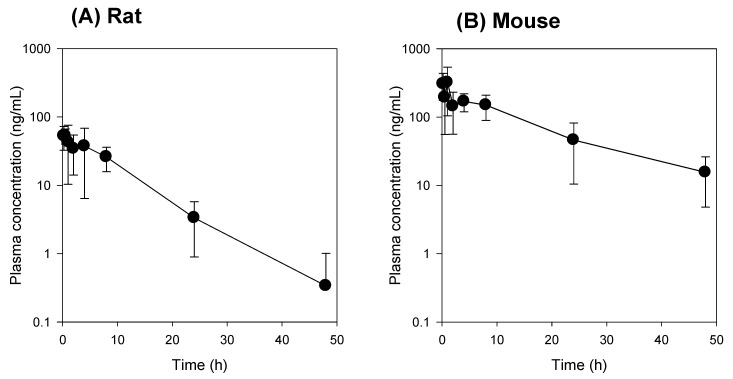
Figure 1.
(A) Plasma concentration vs. time profile of compound K following intravenous injection of compound K at a single dose of 2 mg/kg in rats (A) and mice (B). Plasma concentration of compound K (Y-axis) was represented using a logarithmic scale. Data expressed as mean± standard deviation from four rats or four mice at different time points.

