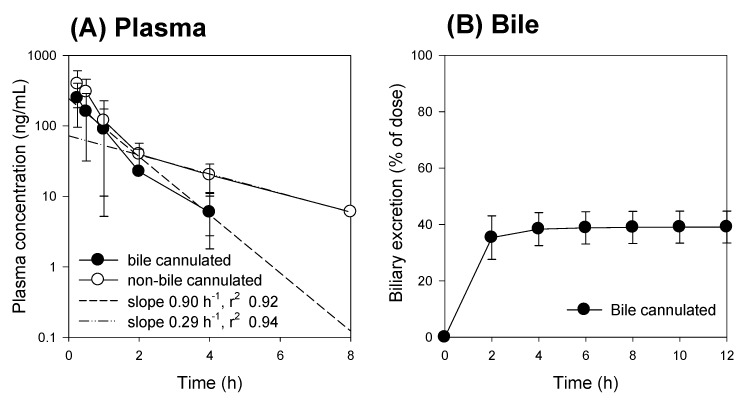
Figure 8.
(A) Plasma concentration and (B) biliary excretion of compound K following intravenous injection at a single dose of 2 mg/kg in the bile-cannulated rats (●) and in the non-bile-cannulated rats (○). Dotted lines represent the regression line of the elimination constant from the plasma concentrations of compound K. Data expressed as mean ± standard deviation from four rats per group.

